studies
What people actually save: a data study (2026)
We analysed the first 119 videos saved on SavedThat. Platform mix, duration distribution, search behaviour, and what early users tell us about saved-video workflows.
SavedThat team10 min read
We analysed the first 119 videos saved on SavedThat. Platform mix, duration distribution, search behaviour, and what early users tell us about saved-video workflows.
Most "what people save" articles are vibes. We pulled the real query.
This is an honest data study of the first 119 videos saved on SavedThat by 43 early users, and the 202 searches those users have run across them. Small sample, transparent caveats. Below: what the numbers actually say about how people save and re-find videos in 2026.
The full breakdown is at the bottom of the post. The three findings that surprised us:
ready as of May 11, 2026)Small. Caveat front-loaded. We'll re-run this when the corpus hits 1,000 and again at 10,000. The patterns at 100 are noisy but interesting because they're current and shaped by who actually signed up for an early-stage product.
What follows is the breakdown.
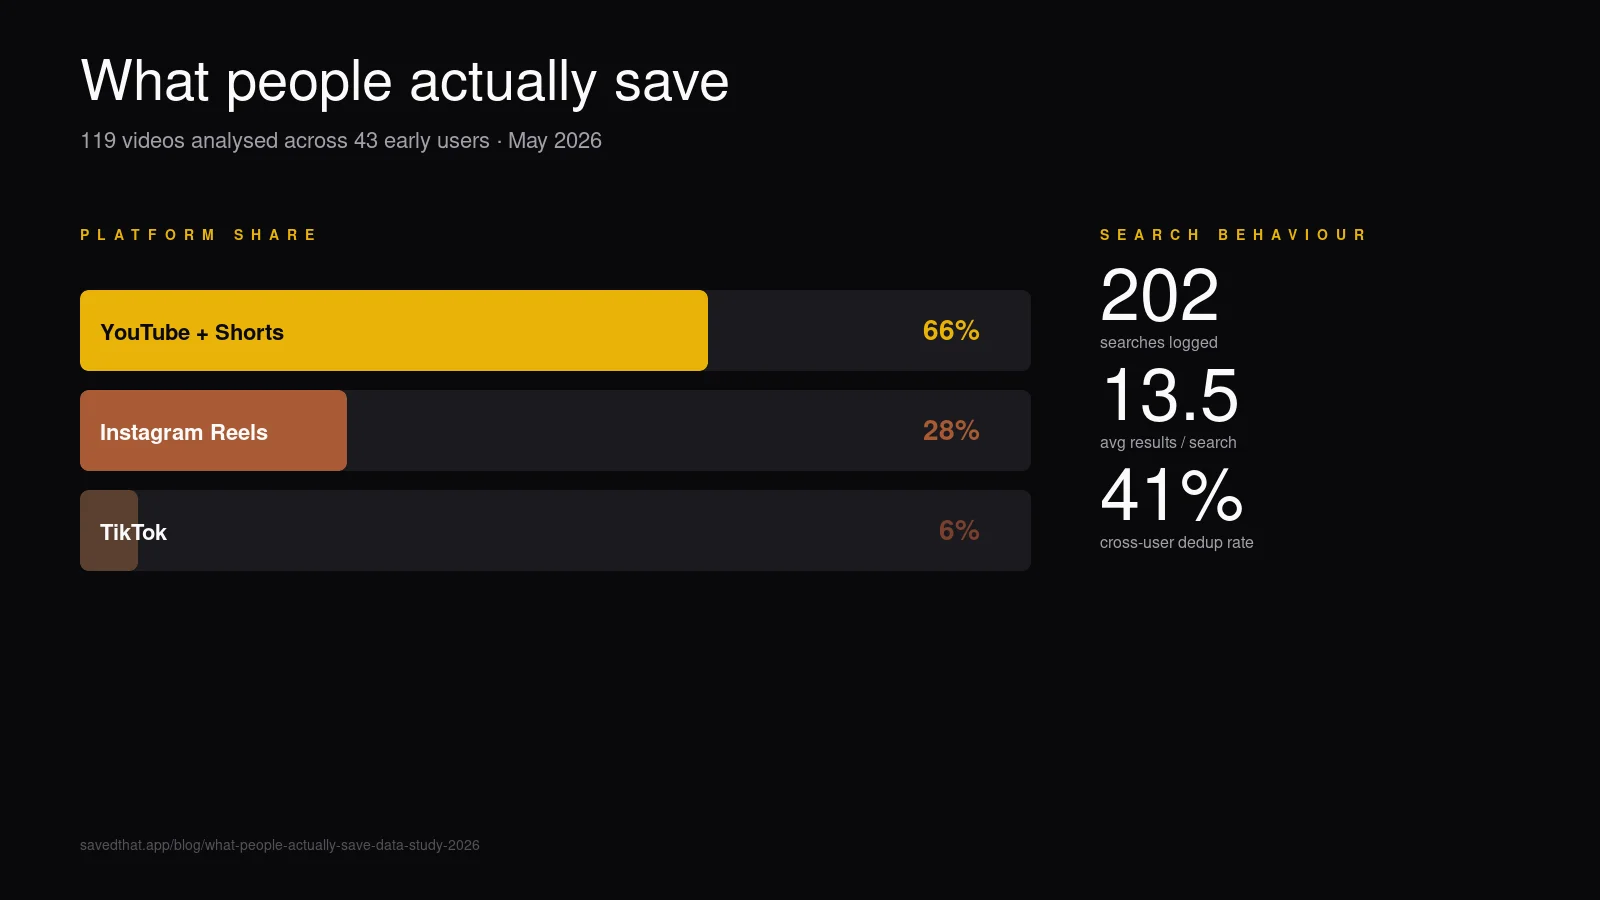
| Platform | Videos saved | % of saves | Avg duration |
|---|---|---|---|
| YouTube + Shorts | 79 | 66% | 30:10 min |
| Instagram Reels | 33 | 28% | 0:56 sec |
| TikTok | 7 | 6% | 0:26 sec |
Two-thirds YouTube confirms what the marketing of every bookmark tool assumes: long-form video saves still dominate the prosumer use case. What surprised us was the gap inside YouTube itself — average 30-minute videos means our early users are saving podcasts, interviews, and conference talks, not Shorts. Compare with YouTube's official median upload duration — the median video on the platform is far shorter, so what people save is sharply biased toward longer content.
Instagram comes in second at 28% — these are short-form Reels averaging under a minute. Saving a Reel and saving a 90-minute Lex Fridman episode are clearly different jobs even though both end up in the same library.
TikTok is third at 6%, mostly because the cohort skews older (founders, researchers, product people). This will rebalance fast as SavedThat's audience widens.
Counts mislead. Let's multiply:
YouTube saves contribute 30× more spoken-content volume than Instagram + TikTok combined. The category looks balanced by count and is heavily lopsided by what's actually inside the videos. This matters for transcript-search workflows: most search queries return YouTube hits not because YouTube is over-represented in saves, but because YouTube videos contain vastly more text to match.
The 119 videos sort into two clear humps with a gap:
| Duration bucket | Videos | % of total |
|---|---|---|
| Under 1 minute | 38 | 32% |
| 1–10 minutes | 28 | 24% |
| 10–30 minutes | 23 | 19% |
| 30–60 minutes | 13 | 11% |
| Over 1 hour | 11 | 9% |
The 32% under-1-minute hump is overwhelmingly Reels and TikToks — quick saves of recipes, demos, jokes. The 19% + 11% + 9% upper humps (43 videos, 36%) are long-form YouTube content where the per-video information density justifies the save.
The middle 1-10 minute bucket (24%) is the weirdest — YouTube tutorials, short Lex Fridman clips, podcast highlights. This is where "watch later" historically went to die because the videos are too long for casual scroll-watching and too short to feel worth scheduling. Transcript search rescues this bucket specifically: at 5 minutes a video, you'd never re-watch to find a quote, so search-by-content is the only retrieval path.
We logged 202 searches by 15 of the 43 users. Three numbers stand out:
The 16% zero-result rate is the most interesting metric. Three diagnostics on why:
These three causes split roughly evenly in the manual review we did on 20 zero-result searches. Each is a product fix; none is a search-engine fix.
The 35% search-engagement rate is honest and probably typical for a tool whose value compounds with library size — at fewer than 5 saves per user, there's nothing useful to search across. We'll re-run this once accounts cross 20 saves on average to see if engagement converges.
158 bookmarks against 112 unique pieces of content means about 41% of users at least once saved a video someone else had already saved. The most-saved single video has 11 bookmarks across users. Average bookmarks per piece of content: 1.41.
This is a direct economic signal. Every duplicate save is a transcript fetch + OpenAI embedding cost we don't pay (Instagram/TikTok are paid via Supadata; YouTube is free but compute-billable). At 41% dedup hit rate in a 43-user corpus, the cross-user content store is already saving real money. At 1,000 users we'd expect the rate to creep toward 70%+ — most popular videos converge.
The product implication: when a new user saves a popular video, it lands in their library in under one second with zero credit cost, because the transcript and embeddings already exist. That experience is a moat — competitors with per-user content stores can't match it.
Three takeaways:
Transcript search is a long-form-video feature. The 30× content-density gap between YouTube and short-form means the technical heavy lifting is on the long-form side. Reel and TikTok transcripts are cheap to fetch and search; YouTube transcripts are where the index volume and retrieval-quality work pays off.
The middle-duration bucket is unowned. 1-10 minute videos make up 24% of saves and are the worst-served by existing tools. YouTube's native "Watch Later" treats them like 60-minute videos (scroll past). The short-form tools (Glasp) treat them like 60-second videos (highlight specific moments). Neither fits. A transcript-search tool that surfaces the 1-10 minute bucket well wins this segment, and almost no one is optimising for it.
Cross-user dedup is undermarketed. Every transcript-search tool except SavedThat treats each user's library as its own database. At 100 users that doesn't matter. At 10,000 users it's the difference between a sustainable margin and burning OpenAI credit on duplicate content. We expect the rest of the category to copy this within 12 months.
This whole study is meant to be re-runnable. We'll publish updates at three milestones:
If you want to be in the next snapshot, the library you save into is the one we count. See pricing or start free.
Everything else in this post derives from this table. We're publishing it so any claim above is verifiable against the source.
| Metric | Value |
|---|---|
| Total videos with `status=ready` | 119 |
| Total user bookmarks (videos.videos rows) | 158 |
| Unique content (videos.video_content_id distinct) | 112 |
| Registered users | 43 |
| Users who have searched at least once | 15 |
| Total searches logged | 202 |
| Average results per search | 13.5 |
| Zero-result searches | 33 (16%) |
| YouTube + Shorts (ready) | 79 |
| Instagram Reels (ready) | 33 |
Snapshot taken: May 11, 2026.
No — that's why this is framed as a snapshot, not a study. Patterns at 100 videos are directionally interesting but statistically thin. We're publishing the methodology and exact numbers so the next snapshot at 1,000 and 10,000 is comparable, not so anyone reading this should make business decisions based on a 119-row sample.
Three video_content rows in `failed` status were excluded (transcript fetch errored out beyond retry limit). All 43 registered users are included regardless of their save count, including the 28 users who haven't searched yet. We did not exclude any user demographics — the snapshot reflects everyone who'd registered as of May 11, 2026.
Count of videos per platform multiplied by mean duration in seconds. This approximates total spoken content because transcript word-count correlates linearly with duration for most speech. We're not counting silent segments, music, or visual content — only the speech-bearing duration.
Cross-user dedup compounds with cohort size. At 43 users sampled from early product launch, most videos still have only one bookmark. As registered users grow, the most-popular videos accumulate bookmarks faster than new videos are saved, and the average climbs. Pocket reached 5-7× average bookmarks per URL at scale; we expect similar trajectory.
| TikTok (ready) | 7 |
| Avg YouTube duration | 1,810 sec (30:10) |
| Avg Reel duration | 56 sec |
| Avg TikTok duration | 26 sec |
| Most-bookmarked single video | 11 users |
| Avg bookmarks per piece of content | 1.41 |
| Cross-user dedup hit rate | ~41% |
Yes — at 1,000 videos, 10,000 videos, and 100,000 videos. Each milestone post will keep the same methodology and table format so readers can diff the numbers directly. Subscribe to the SavedThat blog RSS or follow the founder on X for the next snapshot.
No — saved videos and search queries are private user data and not exportable. The aggregate numbers in this post are computed from anonymised counts; nothing in the published table can be traced back to any individual user or video. If you want to verify the methodology, sign up for SavedThat and you'll see the same query patterns in your own library.
Search inside saved videos by what was actually said — across YouTube, Instagram, and TikTok. How transcript search works in 2026, and four tools that do it.
The best AI video bookmark manager in 2026 depends on what you save. Honest comparison of SavedThat, Mymind, Raindrop, and Glasp — pricing, search, platforms.
The 7 best video transcript search tools in 2026, ranked by what they actually do well. SavedThat, Glasp, Otter, Fireflies, Reduct, Trint, plus DIY Whisper.