Retention curve for Reels, TikTok, Shorts (2026)
A retention curve shows who is still watching each second. How to read it on Instagram, TikTok and Shorts, what a good rate is, and how to predict it.
The retention curve is the most useful chart a short-video creator gets, and the most misread. It answers one question: at second 7, how many of the people who started this video are still here? Every platform draws it a little differently, none of them shows it for other people's videos, and the "good retention rate" numbers floating around are mostly made up.
This guide covers how to read the curve on Instagram, TikTok and YouTube Shorts, what the real benchmarks say, why the drop at 3 seconds happens, and how we estimate a retention curve for videos we have no data for. That last part is the thing we build at SavedThat, so we will be specific about what it can and cannot do.
What is a retention curve?
A retention curve (also called an audience retention graph) plots the share of viewers still watching against time in the video. It starts at 100% at 0:00 and slides down from there. Statisticians call this shape a survival curve: each second, some share of the remaining viewers "leaves", and the curve is what survives. Researchers at the University of Basel and Disney Research modeled video viewing exactly this way, as the hazard of navigating away, and found that visually busier clips were watched longer (Huber et al., 2015).
Two flavors exist, and mixing them up causes most of the confusion:
- Absolute retention is the share of viewers still watching at a given moment. YouTube's API defines it as "the absolute ratio of viewers watching the video at the given point" (YouTube Analytics API).
- Relative retention compares your video with other videos of similar length. A flat line at "above average" can still mean most people left.
The curve can only rise when people rewind or rewatch a part, which is why YouTube calls those bumps "spikes" (YouTube Help).
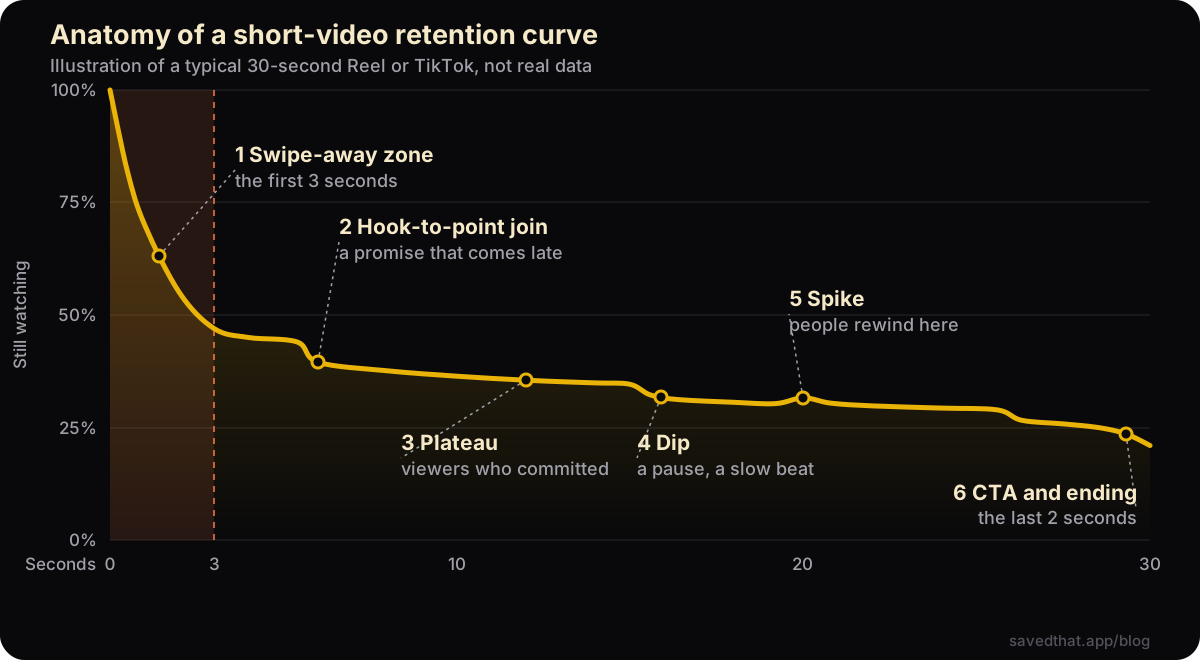
Read any short-video retention curve in six parts:
- The swipe-away zone, 0 to 3 seconds. The steepest part of every curve. People decide from the first frame and the first words.
- The hook-to-point join. A small step where the opening ends and the video either delivers what it promised or keeps warming up.
- The plateau. Viewers who made it this far are committed, and the curve flattens.
- Dips. A pause with nothing said or shown, or a slow stretch, shows up as a notch.
- Spikes. A moment people rewind to: a fast list, a number on screen, a punchline.
- The call to action and the last two seconds. Viewers who sense the end leave early. A video that loops back to its start loses less here.
How to read a retention graph on Instagram, TikTok and YouTube Shorts
Each platform shows the curve for your own uploads and uses its own names for the same ideas. The table is the short version, checked against the official help pages and developer docs in November 2026.
| Instagram Reels | TikTok | YouTube Shorts | |
|---|---|---|---|
| Where the curve lives | Reel, then Insights, retention chart | Post, then Analytics, retention rate | YouTube Studio, then Analytics, audience retention |
| First-seconds metric | Skip rate (left in the first 3 s) | None as a separate number | Stayed to watch vs swiped away |
| Average watch time | Yes | Yes | Average view duration |
| Finish metric | No separate number | Watched full video | Average percentage viewed |
| Curve available through the API | No (average watch time and skip rate only) | No (lifetime averages only) | Yes, for your own channel |
| Other people's videos | No | No | No |
Instagram Reels
Open a Reel, tap Insights and scroll to the retention chart. Meta announced the moment-by-moment chart in November 2023 (Meta), and Instagram later added skip rate, the share of viewers who left in the first 3 seconds, which replaced the older "view rate" (Marketing4eCommerce). Instagram's own reading guide is two sentences long: the flatter the line, the more engaged the audience, and a high skip rate means the beginning did not land.
The developer API is thinner. It returns ig_reels_avg_watch_time and, since December 2025, reels_skip_rate, but no per-second curve (Meta for Developers). Any third-party tool that shows you a full Instagram retention curve is either reading a screenshot or estimating.
Adam Mosseri has named watch time, likes and sends as the three signals that matter most for Reels ranking (Social Media Today), which is why this chart deserves more attention than the view count.
TikTok
In TikTok Studio or the app, open a post's analytics. TikTok defines retention rate as "the percentage of your video that users watched" and tells you to look for drop-off points, next to average watch time and watched full video, the share of people who reached the last few seconds (TikTok Creator Academy). TikTok itself notes that the finish rate swings with video length, so compare a 15-second post only with other 15-second posts.
YouTube Shorts
In YouTube Studio, open a Short and go to Analytics. The first-seconds number is Stayed to watch: "the percentage of times viewers stayed to watch past the initial seconds of a Short". Its opposite is swiped away (YouTube Help). Since March 31, 2025, a Shorts view counts every time the video starts, and the old threshold-based count lives on as engaged views (TechCrunch). Average view duration is calculated from engaged views.
Two YouTube details worth knowing. The "typical retention" line compares the video with your 10 latest videos of similar length, which is the right baseline. And "key moments" (intro, top moments, spikes, dips) only appear on videos at least 60 seconds long with at least 100 views (YouTube Help), so most Shorts never get them.
What is a good retention rate for Reels and TikTok?
No platform publishes one. Instagram, TikTok and YouTube all compare you with videos like yours rather than with a fixed target, and for good reason: a 9-second Reel and a 60-second Reel cannot share a "good" percentage. The public numbers that do exist are vendor studies with different definitions:
- Skip rate on Instagram Reels: Socialinsider measured 9,771,822 organic brand Reels from January to June 2026. Depending on account size, 60.5% to 65.5% of plays were swiped away within 3 seconds, with larger accounts at the lower end (Socialinsider).
- Average watch time on Reels: 8.5 seconds in early 2026, more than double the year before, across 24 million posts in Metricool's study (Social Media Today).
- Average watch time on TikTok: 3.75 seconds across 5.6 million videos in 2024 and 2025, by the same vendor (Social Media Today).
- Average view duration on Shorts: about 16 seconds per Short in Metricool's 2026 YouTube report (Metricool).
If a blog tells you that 50% is "average" and 80% is "great" without naming a dataset, ignore it. We could not find a source behind those bands.
The practical answer: a good retention rate is better than your own median for videos of the same length. Write down skip rate (or stayed to watch), average watch time and the share at the end for your last ten videos, and judge the next one against that. It is the same move YouTube makes with "typical retention", and the same one we recommend for views in our breakout study: compare yourself with yourself.
Why viewers drop at 3 seconds
Because that is when they decide. A feed puts the next video one flick away, so the first frame and the first spoken words do the work of a thumbnail and a title at once. Instagram says it plainly: a high skip rate "indicates that people did not find the beginning of the reel engaging".
What helps, according to the data that exists:
- Talking right away. Emplifi compared 10,110 Facebook Reels and found that videos with speech in the first 3 seconds kept 11.7% more viewers at 3 seconds than music-only ones, and 24.7% more at 10 seconds (Emplifi). It is correlational, and on Facebook rather than Instagram, but the direction is clear.
- Delivering the promise early. This is where our own catalog adds something.
We broke down 2,635 recent English-language Reels and TikToks from more than 550 creators (snapshot of November 10, 2026) and compared 1,027 breakouts, at least 3x their creator's usual views, with 1,395 ordinary videos from the same pool at 0.5x to 1.5x. Here is what the first seconds look like:
| Breakouts (3x+) | Ordinary (about 1x) | |
|---|---|---|
| Start talking within half a second | 92% | 92% |
| Median length of the hook | 5.4 s | 5.2 s |
| Hook over within 3 seconds | 25% | 26% |
| First point or promise within 3 seconds | 34% | 29% |
| First point or promise after 8 seconds | 23% | 27% |
| Call to action, median position | 89% of the runtime | 88% of the runtime |
Two things stand out. First, starting to talk immediately is table stakes: nine in ten videos already do it, hits and misses alike. Second, "finish your hook in 3 seconds" is not what successful videos do. Three quarters of breakouts run their hook longer than that. What they do slightly more often is get to the substance early: the first point or the promise lands within 3 seconds in 34% of breakouts against 29% of ordinary videos, and arrives after 8 seconds less often. The gap is a few points, not a formula. Beat times in our breakdowns are rounded to the second, so treat this as a direction.
The 3-second rule, read properly: the first frame and first words stop the swipe, and the earliest real payoff keeps the people you stopped.
How we chose a way to estimate retention for other people's videos
When we built the Formats tab, we wanted to show where a breakout keeps its viewers. The problem is that nobody has that data for videos they did not post. These are the options we weighed:
| Method | What it measures | Where to get it | Precision | Who can use it |
|---|---|---|---|---|
| Platform analytics | The real per-second curve | Insights, TikTok Studio, YouTube Studio | Exact | Only the creator, only for their own videos |
| Platform APIs | Average watch time, skip rate; full curve on YouTube only | Instagram Graph API, TikTok API, YouTube Analytics API | Exact, but mostly averages | Only the account owner |
| Public reach ratios | Views or likes against the creator's median | Public counters | Says that a video worked, not where people left | Anyone |
| Models trained on watch data | Predicted engagement from the video itself | Research datasets such as SnapUGC | Rank correlation around 0.7 on 90,000 Snapchat videos | Teams that have watch-time labels |
| Virality scores | One number per clip | OpusClip, Higgsfield and similar | No published validation | Anyone with an account |
| Attention heatmaps | Where eyes go on a frame | Neurons, Dragonfly AI | Validated on gaze, not on retention | Paid users |
| Structural estimate (ours) | Expected shape of the curve from the script and its timing | SavedThat breakdowns | An estimate with a range, calibrated on public benchmarks | Anyone, for any public video |
Content-based prediction works in research: the SnapUGC team predicted engagement for about 90,000 Snapchat Spotlight videos from the content alone, with rank correlations around 0.7, and found that classic video-quality scores do not track engagement well (Li et al., 2024). But it needs watch-time labels to learn from, and we have none for Reels or TikToks that are not ours. A trained model without labels is just a guess with a lot of decimals.
So we went the other way: a transparent model whose every input you can see on screen, and which we can later swap for a learned one without changing the interface.
How to predict retention before posting
Our model, version rh-2, draws an expected retention curve from the structure of a video or a script. It runs on every breakdown in Formats and recalculates on every edit in Make your version. Here is what goes in and what it does with it.
Inputs, all read from the breakdown or your script:
- the beats with their start times: hook, promise, points, proof, payoff, call to action;
- the hook type (a bold claim, a how-to, a question, a list and so on), its length in seconds and words, and whether there is text on screen;
- spoken words per second in each beat, and stretches where nothing is said or shown;
- how specific each line is: numbers and names count up, filler such as "trust me" or "game changer" counts down;
- whether the video loops back to its start.
What the model does:
- The hook takes the biggest bite. Most of the swipe-away loss happens in the opening, sized by hook quality. Even the best hook in the model keeps under about two thirds of viewers, because no real curve stays near 100%.
- The join can cost a step. If the first point arrives later than about 4 seconds, or the hook drags, the curve drops a step at the join and the chart says why: "the promise comes late" or "the hook runs long".
- The body decays slowly. Proof and payoff hold better; each new point eases the decline; slow, very dense or long beats and silent pauses speed it up.
- Viewers who stayed become stickier. The longer someone has watched, the less likely they are to leave in the next second, and a committed share past the hook never leaks away from decay alone. That is why long videos do not slide to zero.
- The ending costs extra. A call to action and the last second and a half drop faster, less so when the video loops.
The parameters are calibrated so that an average video lands near the public benchmarks above, such as the 60 to 66% skip rate on Reels. A video that already beat its creator's usual reach is anchored slightly higher, because a known breakout should not draw as average.
What it cannot do: tell you whether a video will go viral. Our breakout study found that hits and misses from the same creator are built almost identically, and the difference is mostly the topic. A retention estimate catches a slow opening. It does not catch a boring subject.
How to use a retention curve without SavedThat
You do not need a tool to get most of the value. For your own videos:
- Open the curve in Insights, TikTok Studio or YouTube Studio, on a video at least two days old so the data has settled.
- Find the first steep drop after the 3-second mark. Ignore the opening slope, every video has it. Note the second where the line bends.
- Scrub to that second and write down what is said and shown. Turning on captions or pulling the transcript makes this faster than listening.
- Name the cause. In our experience it is almost always one of five: the promise comes late, the hook keeps going after it has done its job, a pause with nothing on screen, a slow or overloaded stretch, or a call to action that signals the end.
- Rewrite that moment. Move the payoff into the first sentence, cut the warm-up line, put the number on screen, or move the call to action into the last second.
- Judge the next video against your own median for the same length, not against a number from a blog.
For other people's videos, where you have no curve, build the structure by hand: play the video with a stopwatch and note when the hook ends, when the first real point lands, where nothing is said, and where the call to action starts. Do it for five videos that did well in your niche and five that did not. The pattern you are looking for is the time to the first payoff.
How to use it with SavedThat
SavedThat does the stopwatch part for you and keeps the results searchable:
- Save the references. Share a Reel, TikTok or Short to SavedThat and it becomes searchable by what was said, so you can find "that video where she opens with the price" months later. How the transcription works is in our guide to transcribing saved Reels.
- Study breakouts in Formats. The Formats tab shows videos getting 3x or more their creator's usual views in 14 niches. Each breakdown has a colored bar with the hook, points and call to action, and the estimated retention curve, with a plain-words note where the likely drop is.
- Make your version. Rewrite a breakout for your own topic. The curve recalculates on every edit, so you see whether moving the promise forward actually lifts it.
- Ask Claude about your saves. Connect SavedThat to Claude and ask across your library, for example "how do the cooking Reels I saved open in the first five seconds?", with timestamps you can tap.
The same curve is coming to Trends in the mobile apps.
Keep reading
What makes Reels go viral: 2,635 analyzed (2026)
What makes Reels go viral, measured on 2,635 recent Reels and TikToks: breakouts look exactly like the creator's flops. The topic is what changes.
Transcribe saved Reels and search them (2026)
Transcribe saved Instagram Reels and search the transcripts: what Instagram gives you, the apps that do it automatically, and the DIY Whisper route.
Instagram Reels search by spoken words (2026)
Instagram Reels search by spoken words is still not native, even with Instagram's new Saved search. Four workarounds that find a Reel by what was said.
Frequently asked questions (2026)
What is a retention curve?
A retention curve shows the share of viewers still watching at each moment of a video. It starts at 100% and falls, steepest in the first seconds of a short video, and it rises only where people rewind or rewatch.
How do I see the retention graph for my Instagram Reels?
Open the Reel, tap Insights and scroll to the retention chart. Instagram also shows skip rate, the share of viewers who left in the first 3 seconds, and average watch time. The API returns only the averages, not the curve.
What is a good retention rate for Reels?
Instagram publishes no benchmark. In Socialinsider's 2026 study of 9.8 million brand Reels, 60.5% to 65.5% of plays were swiped away within 3 seconds, depending on account size. The useful target is beating your own median for videos of the same length.
What is skip rate on Instagram?
Skip rate is the percentage of views where people swiped away within the first 3 seconds of a Reel. A high skip rate means the opening frame and first words did not stop the scroll.
Why do viewers drop off in the first 3 seconds?
Because the feed makes leaving free, people decide on the first frame and the first words. Speech from the start helps, and in our catalog breakouts reached their first point within 3 seconds more often than ordinary videos (34% vs 29%).
Can I see the retention curve of someone else's video?
No. Instagram, TikTok and YouTube show retention only to the creator, and no public API exposes it. You can map the structure by hand with a stopwatch, or use an estimate such as the one in SavedThat's Formats tab.
Can you predict retention before posting?
You can estimate its shape. SavedThat's model draws an expected curve from the script's timing: hook length, when the first point arrives, pace, pauses and the call to action. It is calibrated on public benchmarks, shows a range, and cannot see the picture, sound or topic.